
Deep Data Dive with Kusto for Azure Data Explorer and Log Analytics
Small talk about big data
Azure provides some incredible services for storing and analyzing data. One service I use every day is Azure Monitor. It automatically gathers information from my serverless link shortener app and surfaces analytics and insights through Application Insights.
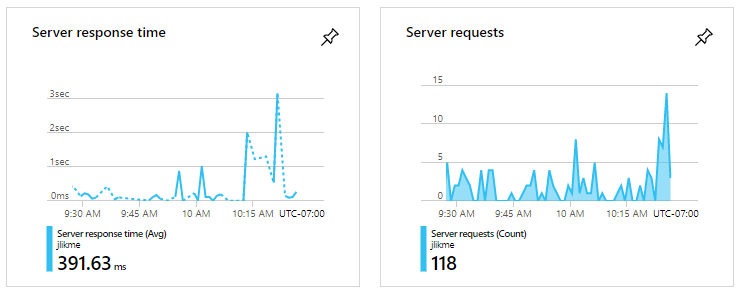
My logs are automatically captured through Log Analytics and I can investigate the data using Azure Data Explorer. The service for storing and handling interactive analytics is called Kusto, and it has a unique query syntax that is similar to SQL. There is plenty of in-depth documentation about Kusto. I struggled with it until I started my new role as .NET Data PM and began looking into telemetry about how .NET users manage data in their applications. I had some ah-hah moments I want to share.
Finding Kusto
Enhancing serverless functions with Application Insights is as simple as checking a box when you create the host. This generates a ton of metrics without touching your code. You can extend what’s out of the box with extra functionality. I customized my code to raise an event that lists the medium of a click event. For example, if I shared the link on Twitter, a “twitter” event is emitted. The code looks like this:
public static TelemetryClient telemetry = new TelemetryClient()
{
#if !DEBUG
    InstrumentationKey = Environment.GetEnvironmentVariable("APPINSIGHTS_INSTRUMENTATIONKEY")
#endif
};
// other code
telemetry.TrackEvent(medium);
// other code
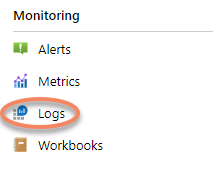
Simple enough, right? Now let’s find the results. First, I navigate to my Application Insights instance in the portal. I scroll down to Monitoring and choose Logs.
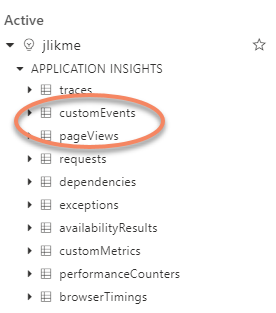
This takes me to the data explorer. I get a handy list of data sources that I can work with and a text box to enter my query. I’ve highlighted two data sources that are interesting to me.
Kusto basics
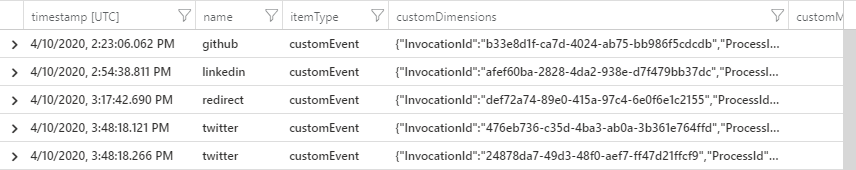
The real ah-hah moment that came to me was how Kusto works. If you think of it as a pipeline, you’ll do just fine. Let’s examine the customEvents data source first. Just stating the data source name injects it into the pipeline and returns its rows. Don’t run the query yet!
customEvents
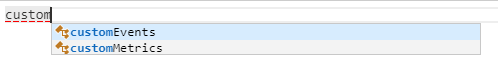
Notice you get full autocompletion in the browser. This works for tables as well as properties.
First, we want to make sure we don’t load too much data. Five rows should be enough to shape the data. So, I insert a command to limit the rows into the pipeline:
customEvents
| take 5
This gives me 5 rows:
Let’s do the same thing with pageViews.
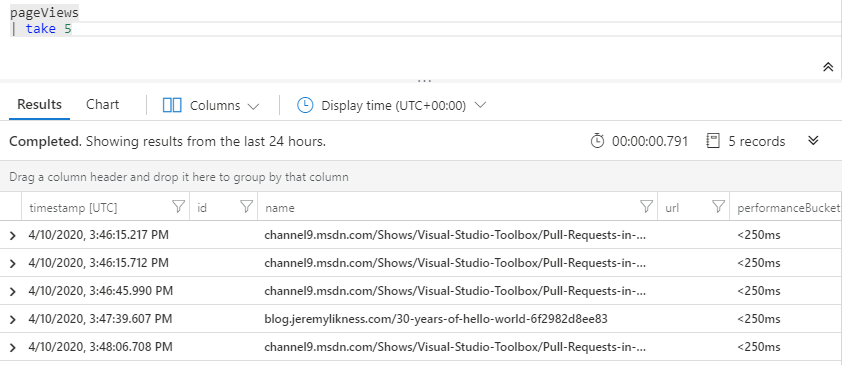
Great! Now we can start to do something more interesting.
Summarize data
Here’s my goal:
Show me the top five most clicked pages in the past 24 hours and break them down by medium.
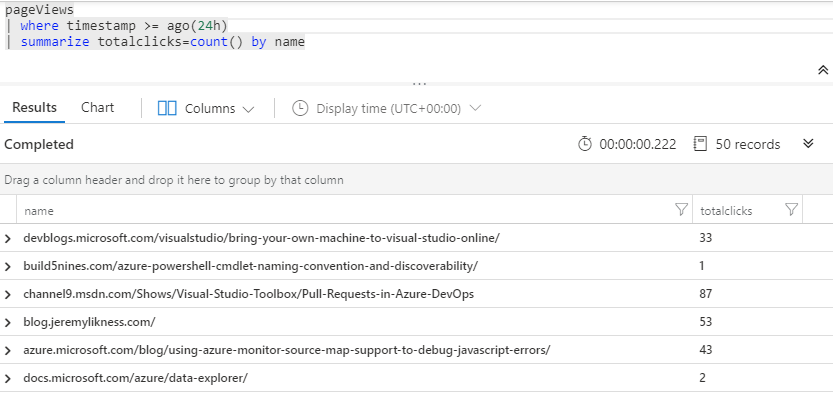
First, we’ll need to filter for the past day and summarize by page (the URL is stored in the name property.)
pageViews
| where timestamp >= ago(24h)
| summarize totalclicks=count() by name
Here’s the result. Notice there are 50 records in total.
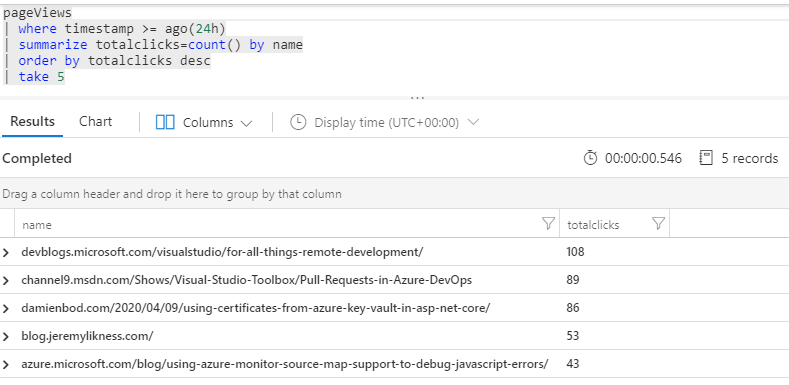
Next, we want to order by clicks and take the top five. Here’s where Kusto diverges from SQL in how you compose queries: with SQL, you need to think in terms of sets and possibly use table expressions or resort to temporary tables. In Kusto, we are just walking through a pipeline. So, we add on the order and summary like this:
pageViews
| where timestamp >= ago(24h)
| summarize totalclicks=count() by name
| order by totalclicks desc
| take 5
The result is my most clicked pages in the past 24 hours.
Alias your “views”
I want to use the top five pages later in my pipeline, but instead of trying to join to the full query, I can simply alias it and reference it like a view later in the pipeline. This is how to alias the query:
let top5pages=pageViews
| where timestamp >= ago(24h)
| summarize totalclicks=count() by name
| order by totalclicks desc
| take 5;
This won’t run by itself because Kusto expects every query to end with tabular data. We’ve aliased a query but aren’t using it yet. To make it “runnable” we simply express the view in the pipeline:
let top5pages=pageViews
| where timestamp >= ago(24h)
| summarize totalclicks=count() by name
| order by totalclicks desc
| take 5;
top5pages;
Tip: it is easy to think of the query as having multiple steps. However, everything is considered a single batch of work and Kusto will examine the entire set of statements to optimize and produce your results.
Shape the data
Now I want to look at custom events. The first issue I have is that the event property name is the same as the page property name. Therefore, I want to change the name of the property to type. There are a lot of properties in the customEvents data source. I’m only interested in two: the type or medium, and the operation_Id. This is a unique identifier I can use to join back to the pageViews data source.
The extend statement allows me to inject new columns. I can assign a literal or use it to move the value from one property into another as I do here. To shift name into type I simply add:
| extend type=name
The project statement allows me to specify what properties I want, like select in SQL. Here’s the full query:
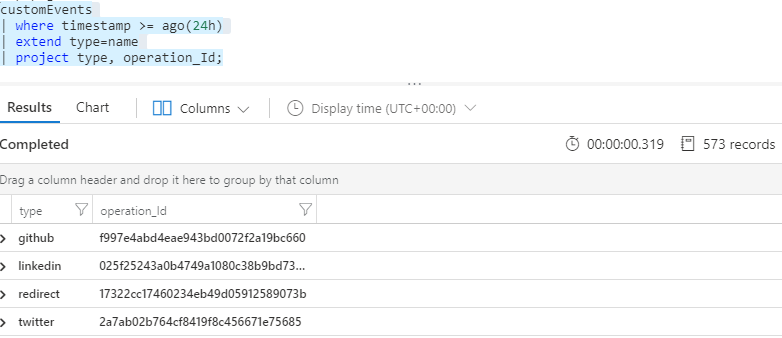
customEvents
| where timestamp >= ago(24h)
| extend type=name
| project type, operation_Id;
The result is a list of type and operation identifiers.
I aliased the last view to custom. I realized I have two filters that look back 24 hours. It makes sense to ensure they are consistent, so I created an alias for that expression too. This is where I’m at (this query isn’t runnable because it doesn’t return any data yet).
let cutoff = ago(24h);
let top5pages = pageViews
| where timestamp >= cutoff
| summarize totalclicks=count() by name
| order by totalclicks desc
| take 5;
let custom = customEvents
| where timestamp >= cutoff
| extend type=name
| project type, operation_Id;
Now let’s get to some results!
Join for the result
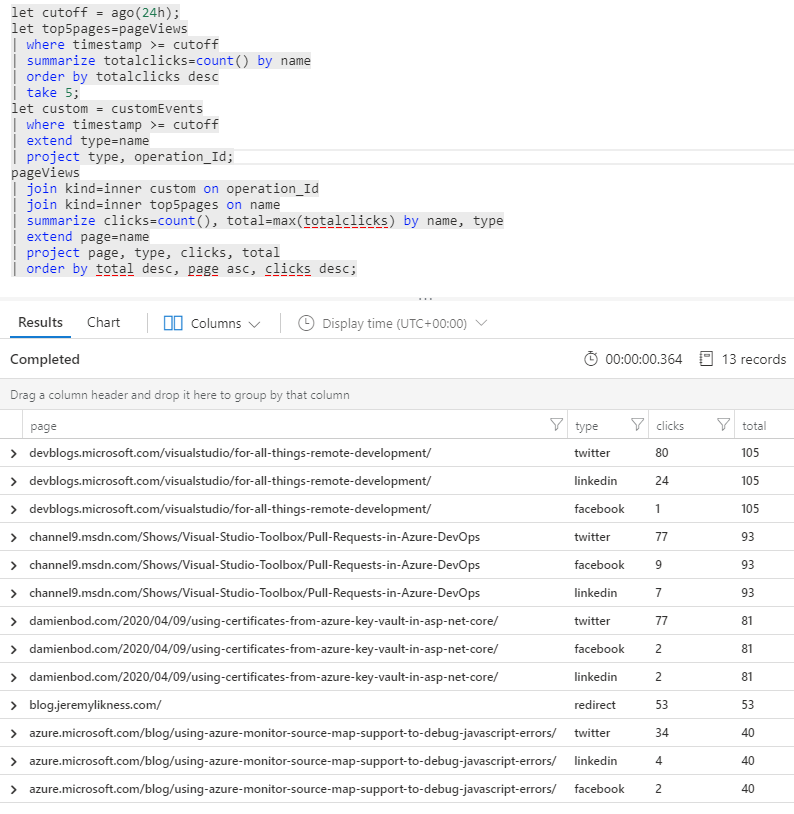
I want to include exact matches for custom events, so my first join will need to be an inner join. I only want to include the top five pages, so I’ll also do an inner join to that table. Finally, I want to order by the page with the most clicks first. Here is the last query in the pipeline. Notice how I join to the aliases I created the same way I would join to an ordinary table or data source.
pageViews
| join kind=inner custom on operation_Id
| join kind=inner top5pages on name
| summarize clicks=count(), total=max(totalclicks) by name, type
| extend page=name
| project page, type, clicks, total
| order by total desc, page asc, clicks desc;
Notice the join syntax (if my property was named something different, like id, the syntax would be custom on $left.id == $right.operation_Id). I’m creating two scalar columns: one with clicks within the medium, and another with the total clicks for the page. Finally, I’m shaping and ordering the data.
The aliases helped me craft the query, and make it easier to read and more maintainable. This is the exact same query that produces the same results without using aliases:
pageViews
| join kind=inner
(
    customEvents
    | where timestamp >= ago(24h)
    | extend type=name
    | project type, operation_Id
)
on operation_Id
| join kind=inner
(
    pageViews
    | where timestamp >= ago(24h)
    | summarize totalclicks=count() by name
    | order by totalclicks desc
    | take 5
)
on name
| summarize clicks=count(), total=max(totalclicks) by name, type
| extend page=name
| project page, type, clicks, total
| order by total desc, page asc, clicks desc;
The “expanded” approach isn’t quite as easy to maintain. Aliases also become more useful when you need to join to the same query multiple times. Query code reuse for the win!
Visualize the data
This is the shortest section of the post, because to visualize the data I simply click on the Chart option. It immediately renders the chart that makes the most sense based on the data, while allowing you to tweak the type and content as needed. Here, without me doing a thing, Kusto was smart enough to determine I wanted to group my data by page and view the relative impact of medium or type on clicks.
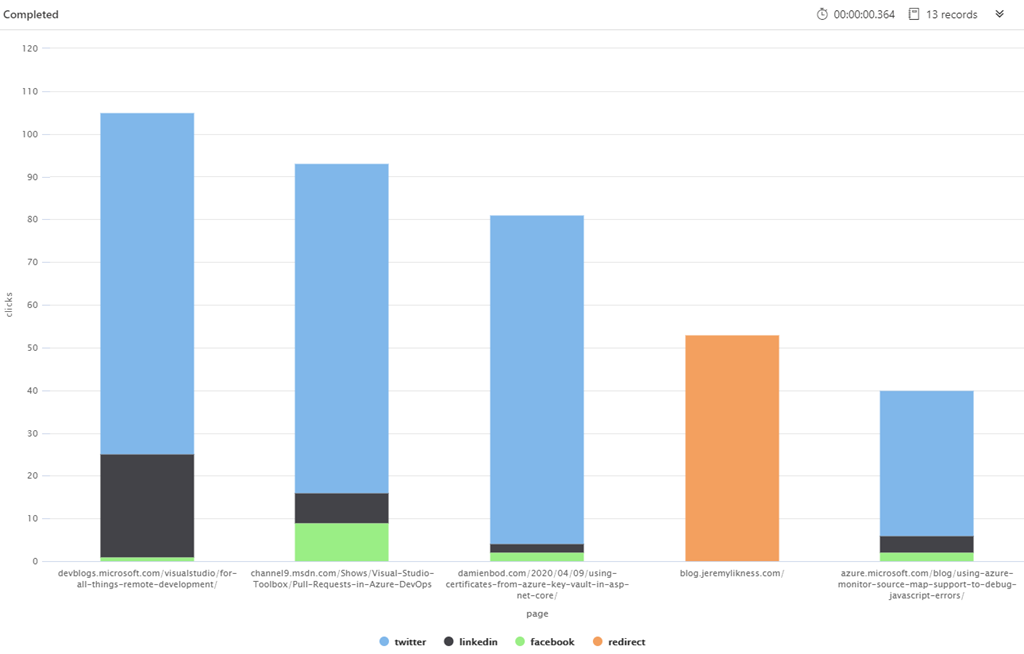
It is immediately evident that Twitter is the clear leader for engagement, followed by LinkedIn at a distant 2nd place. Now that I have a working query, I can save it and within milliseconds see a real-time view of the top five clicked pages in the past 24 hours.
Conclusion
There is a lot more you can do with Kusto. I hope this helps you craft your own queries by moving out of the SQL set-based mindset and into the pipeline processing mindset. I also hope the way I shared the steps in the process serves as a guide to break down what may seem intimidating and/or complex problems up front into tangible “pieces” that compose the final solution. For me, the final step was to pull the Kusto output into Power BI for an up-to-date, interactive dashboard I can use to view my data “at a glance.”
Do you have any Kusto stories or tips to share? Any questions I can help with? Please use the comments below to let me know!
Regards,

Related articles:
- Atlanta Code Camp 2017: Serverless .NET (Application Insights)
- Azure Cosmos DB With EF Core on Blazor Server (Azure)
- Dynamically Build LINQ Expressions (Data)
- Inspect and Mutate IQueryable Expression Trees (Data)
- Look Behind the IQueryable Curtain (Data)
- The Year of Angular on .NET Core, WebAssembly, and Blazor: 2019 in Review (Azure)