
Real-Time Insights with Real-Low Effort
How Azure Application Insights can give you all the data you need with a click and a few lines of code.
Part of the series: Serverless Link Shortener
I still recall the day I first learned about Application Insights. At the time (several years ago) I was working on a web application and App Insights was mentioned as a possible alternative to the analytics product I was using. We thought it was just another way to track web pages and maybe get some light performance data, but we were wrong. Dead wrong.
Today, Azure App Insights is an incredibly mature product that provides a view across your entire application stack. A short list of features and benefits include:
- Metrics from the browser, server, database, and just about any other asset that is part of your pipeline
- All data is available for data-mining and customized analytics
- You have the ability to track custom metrics including events, page views, and dependencies
- Automatic machine learning adapts to your app behavior, alerts you when anomalies are found and helps reveal the root cause
- Real-time tracking of requests, events, telemetry data, CPU, memory, and other performance indicators
- Usability analysis like common paths taken in your application
The list goes on, but instead of writing about what it can do, I wrote this post to show you what it does do. You may have read my previous article about building a URL link shortening tool (or, when you saw how long the article was, you may have just skimmed it … that’s OK, I have a lot on my plate, too!):
How to leverage Azure Functions, Azure Table Storage, and Application Insights to build a serverless custom URL shortening tool.
In the article I show how to click a checkbox and add a few lines of code to track App Analytics. In fact, following is the code that tracks three custom items: how long it takes to access an entry in Azure Table Storage, a count of page views(where the shortening tool is redirecting to), and a summary of custom events (which channel or medium such as Twitter or Facebook is associated with the request). Just look for “BOOM” in the comments.
var startTime = DateTime.UtcNow;
var timer = System.Diagnostics.Stopwatch.StartNew();

TableOperation operation = TableOperation.Retrieve<ShortUrl>(partitionKey, shortUrl);
TableResult result = inputTable.Execute(operation);

// BOOM track a custom dependency!
telemetry.TrackDependency("AzureTableStorage", "Retrieve", startTime, timer.Elapsed, result.Result != null);

ShortUrl fullUrl = result.Result as ShortUrl;
if (fullUrl != null)
{
    log.Info($"Found it: {fullUrl.Url}");
    redirectUrl = WebUtility.UrlDecode(fullUrl.Url);
    // BOOM track a page view
    telemetry.TrackPageView(redirectUrl);
    if (!string.IsNullOrWhiteSpace(fullUrl.Medium))
    {
        // BOOM track a custom event
        telemetry.TrackEvent(fullUrl.Medium);
    }
}
You can build custom analytics queries to slice and data all data captured by Application Insights, including your custom telemetry.
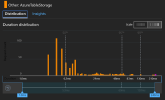
Speaking of telemetry, I love being able to watch requests to my custom URL shortening endpoint in real-time.
I wanted to build something inexpensive, so I opted for the least expensive plan. Sometimes there is a performance hit when a function hasn’t been accessed in awhile, as evidenced by a delay between when the endpoint is contacted and when my function code is actually called. I can mitigate that somewhat by using a timer to ping the endpoint and keep it warm, but it’s important to note that if performance ever drops too low, I can convert to a different plan that keeps the machines always on or “warm.” I know from my telemetry that almost all delays are caused by waking up the endpoint because the table storage calls are always fast.
To see just how I track this and what other information is available, I created a short (and silent) video with a live walk through of the real data for my website.
If you’re struggling to find a solution that provides rich telemetry combined with deep machine learning insights and automatic anomaly detection with low overhead and development impact, take a serious look at Application Insights. Let me know what you think in the comments below!

Part of the series: Serverless Link Shortener